EnviroSense

Currently, expensive static curb side sensors costing £40K-£50K are used to measure NO2 and PM2.5µ particulates.

These installations use laboratory grade Chemiluminescent analysers that need to operate in stable temperature controlled enclosure and require an air conditioner. They also need to be maintained and calibrated every month with calibration gas at sub-optimal levels, at a typical cost of £10K / Year.

These installations cannot provide a clear picture of the problem over wider areas and do not provide an accurate measurement of real conditions where humans walk.

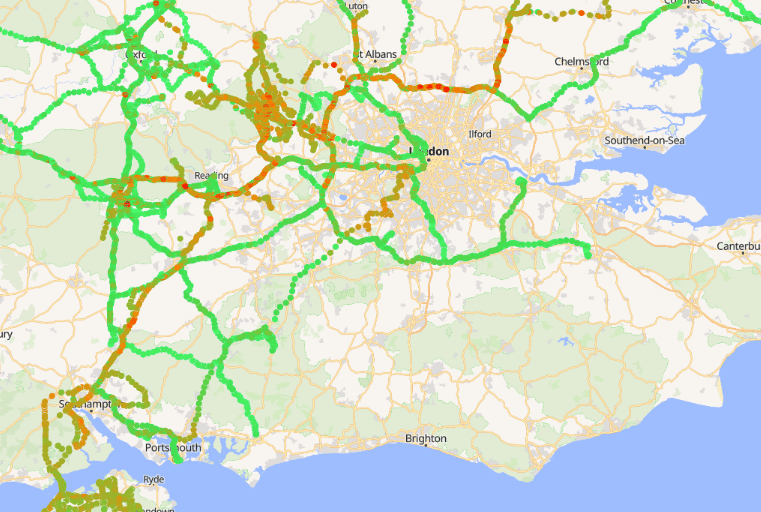
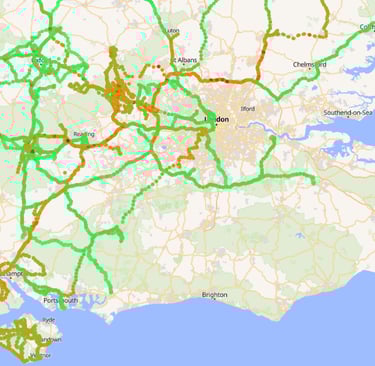
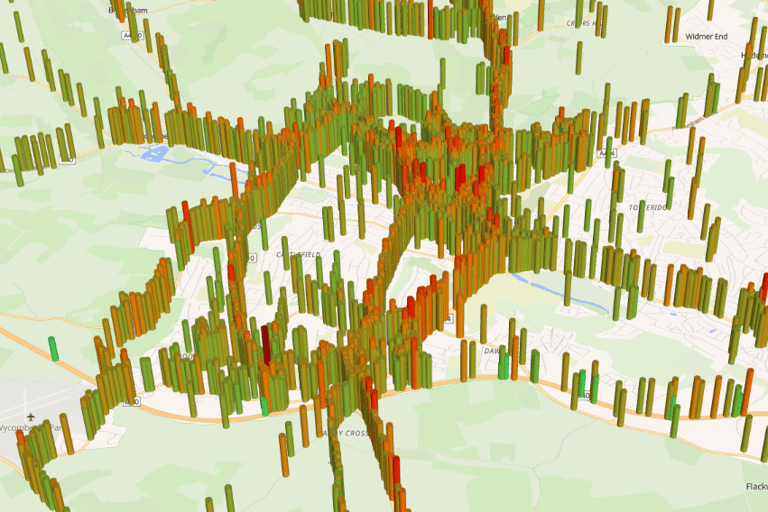
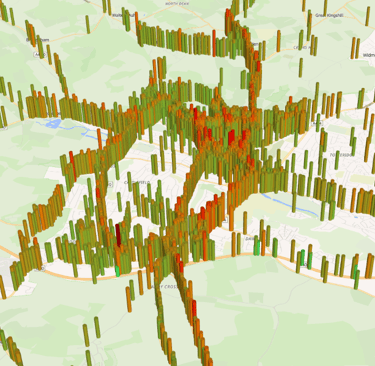
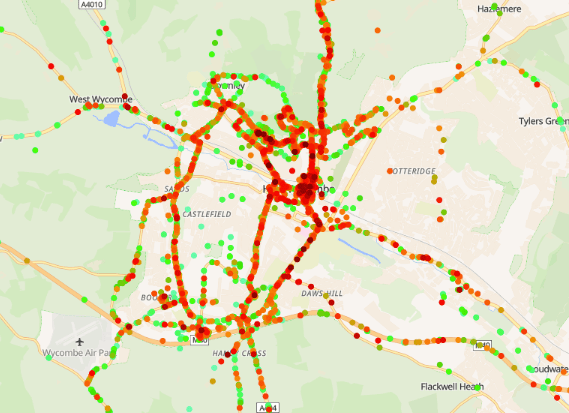
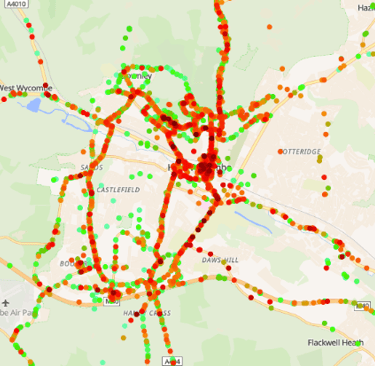
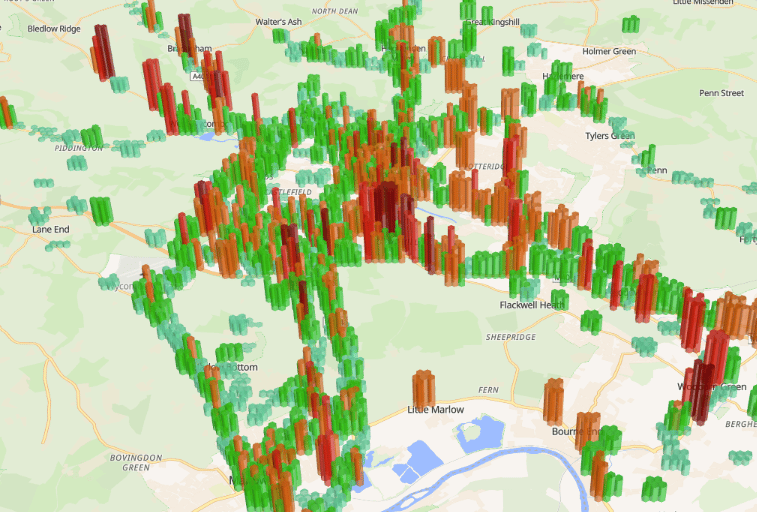
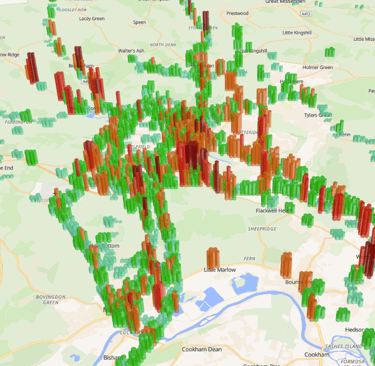
Measuring urban air quality at STREET LEVEL where humans walk, and breathe requires multiple sensors and frequent readings.

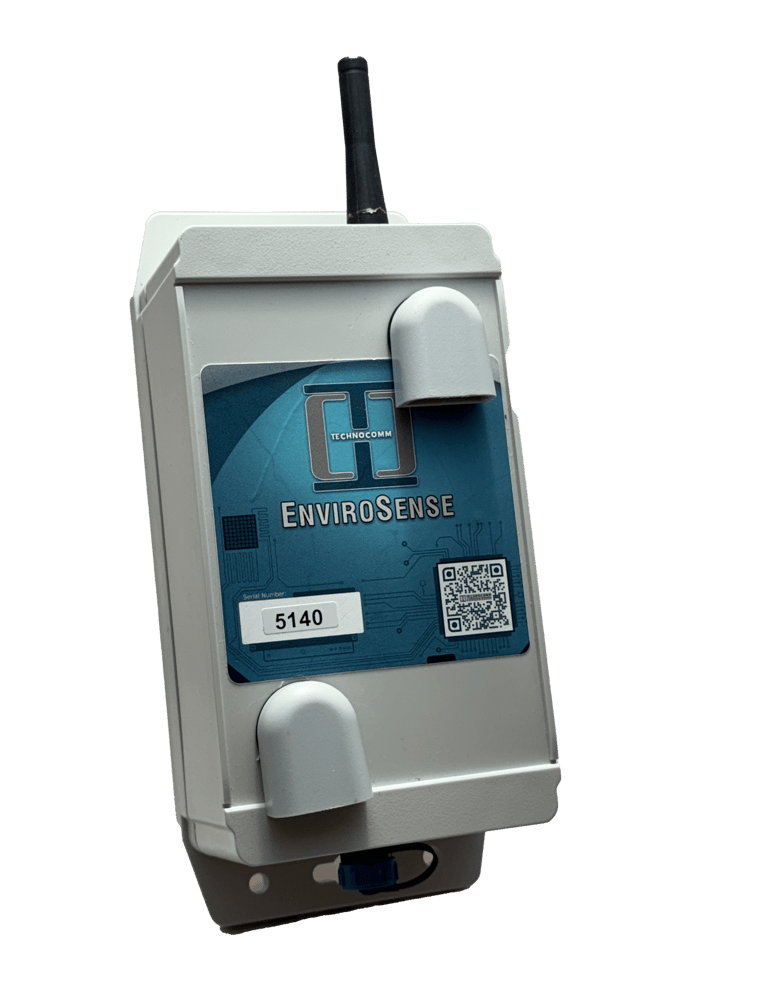
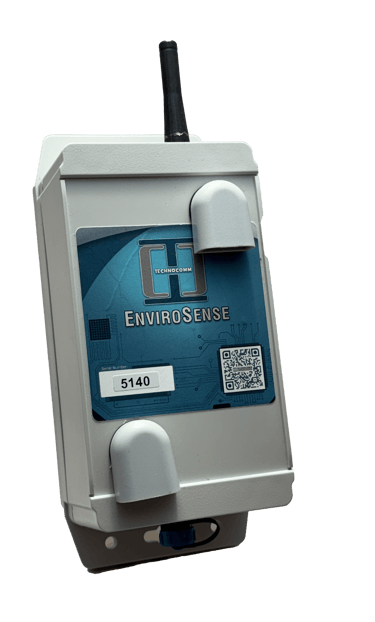
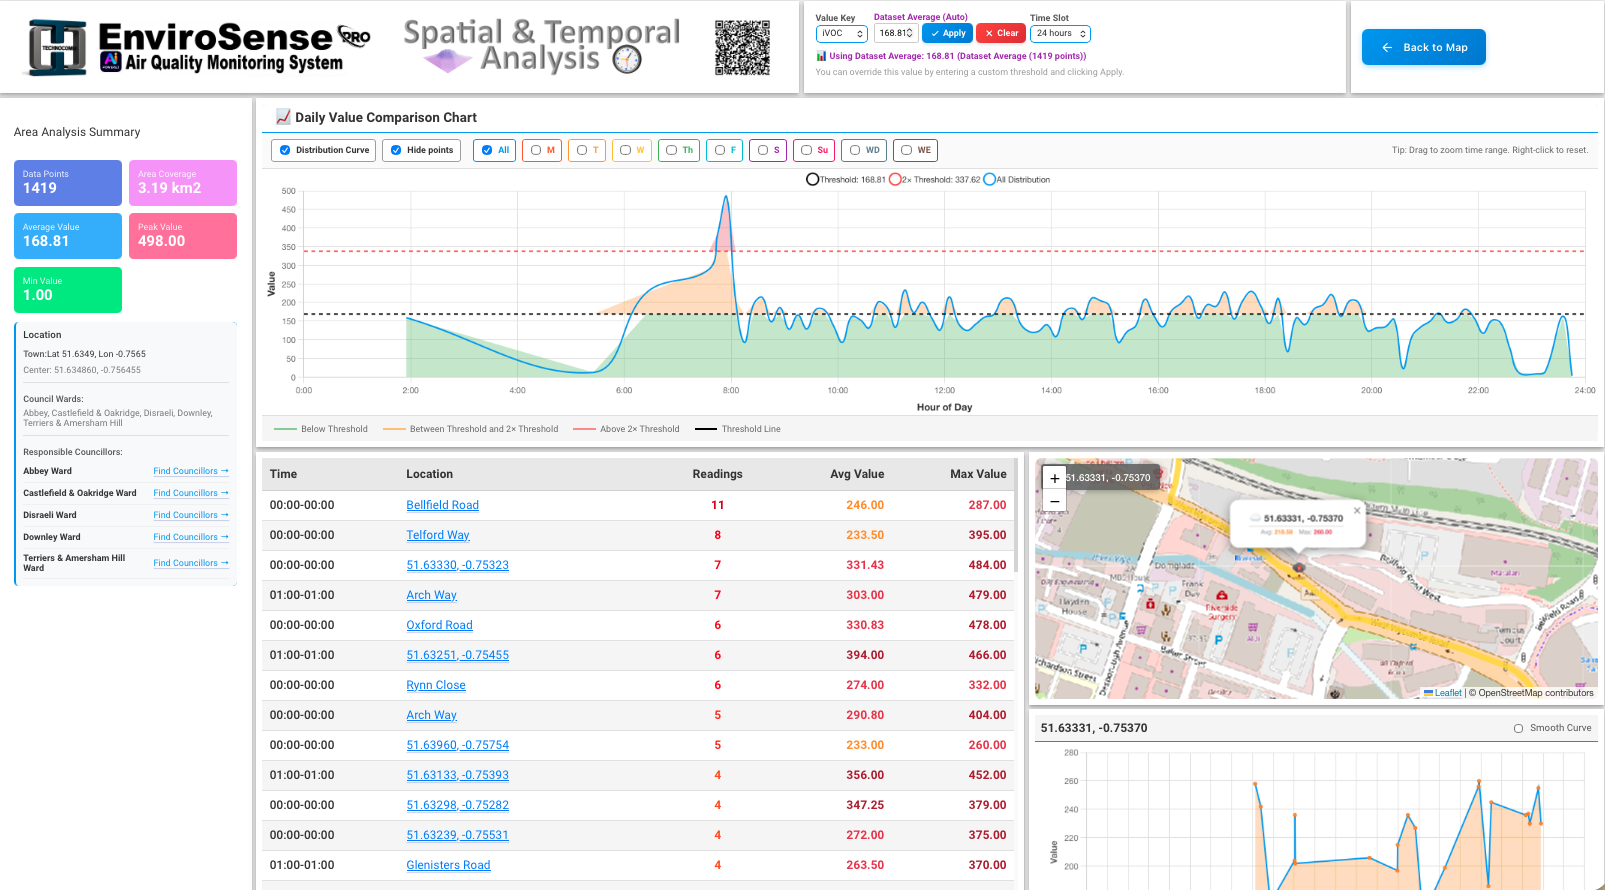
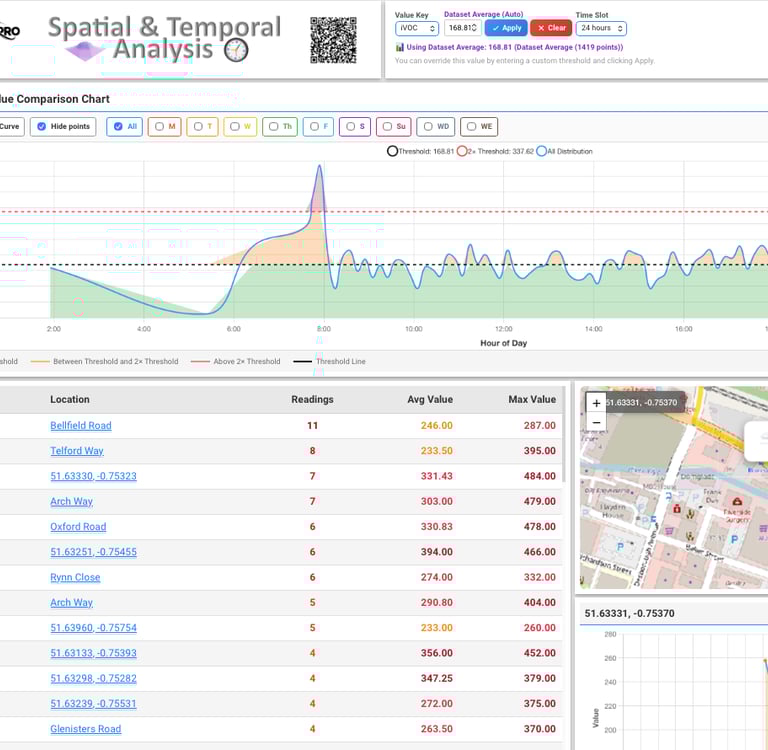
A single EnviroSense unit can record up to 5000 readings per day and is small enough (~ 140 x 50 x 40mm) to be mounted on moving public vehicles (busses, taxis, couriers) as well as in static locations. This enables reliable, accurate readings to be accessed on an easy-to-use dashboard with access to LIVE data as well as historical records. Power consumption is ~1.5W in operation.

Tollworth Air Station measures NO2 / PM2.5µ

The Great Smog of 1952 killed ~10,000 people in 5 days and 4,000+ Londoners still die of air pollution every year and ~ 7M premature deaths annually worldwide (WHO).

Experts warn that without immediate emission cuts, these extreme weather patterns will worsen, affecting ecosystems and human livelihoods.

Kingston on Thames Air Station NO2 / PM2.5µ

EnviroSense versions

All units measure Temperature Humidity and Barometric pressure for internal compensation.

EnviroSense

  • CO2 , PM2.5µ, PM10µ, NOx Index, VOC(*) Index

  • Options for H2S and CH4

EnviroSense AI

Addition of NO2 / SO2 / CO / O3

Dynamic continuous Machine Learning and AI correction for electrochemical sensors.

Options for Methane (CH4) and (H2S) also available

(*)VOC's = Volatile Organic Compounds

(**) PID = Photo Ionisation Detector

EnviroSense markets

Environmental agencies
– Road traffic optimisation
– Urban air quality monitoring

Public venues
– Conference centres, museums
– Education, schools, universities
– Hospitals, care homes

Visualisation examples

Contour Map with clusterisation

Detailed Analysis of selected zone with weekly/daily trends report

Overview of CO2 Emissions - 150 days

3D pipe zoom view of selected area

Zoom of VOC Emissions - 150 days

3D Clustered Hex view

HVAC manufacturers
– Commercial buildings

Hotels / hospitality

Public Transport
– Buses, trains....